Covid Graph
Created by Hider-alt
0
Download
Informations
Author: Hider-alt
Downloads: 147
Stars: 0
Type: Home Screen Widget
Published on: 28 September 2022
Description
NO LONGER MAINTAINED
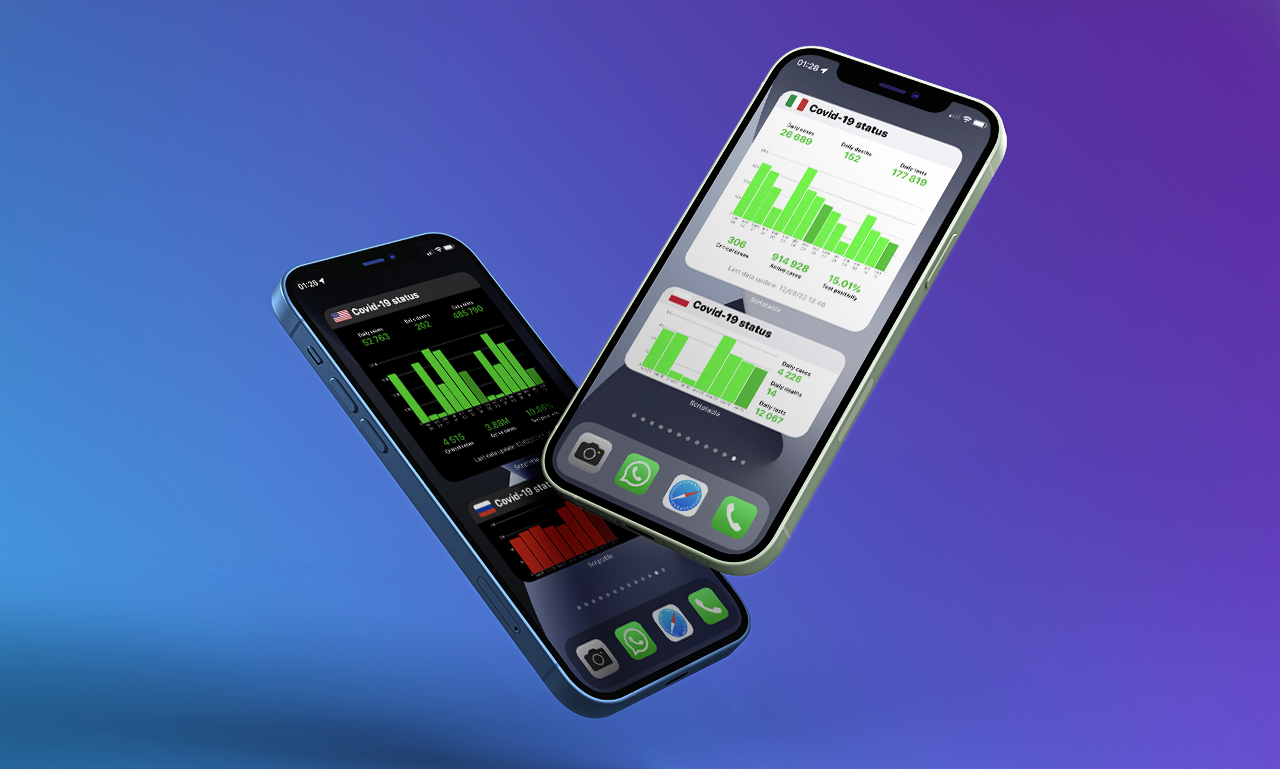
Covid iOS Widget
This Widget shows a graph of Covid cases for the last 8/15 days of the selected country.
How to install
Click here to see images of the instructions
- Download Scriptable from the App Store.
- Download a Scriptable file from the release page.
- Once downloaded, click the Share button.
- Click on the Scriptable icon.
- Click on "Add to My Scripts".
- Click on "Done".
Add widget to the home-screen
Click here to see images of the instructions
- Add a new Scriptable widget to the home-screen.
- In "Script" select CovidGraph.
- In "Parameter" select the country name you want to show in the widget.
How to update
Click here to see images of the instructions
- To update the widget, just click on it, and it will redirect to the release page.
- Close momentarily Safari.
- Delete CovidGraph script in Scriptable.
- Go to the release page on Safari and download the Scriptable file.
- Make steps from 3 of the installation instructions.
Features
- The widget shows a graph of Covid cases for the last 8 days in the small or medium version and for the last 15 days in the large version for the selected country in the parameter.
- The graph will be colored of green if the number of cases is less than the number of cases in the 7 days before, red if the number of cases is more than the number of cases in the 7 days before.
Updates
- When a new version is released, it will be written in the widget title.
- To update the widget, just click on it, and it will redirect to the latest release page
- Then you will have just to follow the instructions of How to update section.
Note: Some data countries are partially available, so the graph could be partially empty (e.g. UK). This happens due to countries not reporting cases daily
Requirements
- Scriptable
- iPhone/iPad/Mac
- iOS 14.0 or later / macOS Big Sur or later
FAQ
How can I change the country?
In the parameter of the Widget, write the country you want to show.
What sizes are available?
The widget has 3 sizes: small, medium and large.
What are data around the graph referring to?
The data around the graph refers to data of the last day.
What's next?
- Add an optional line in the graph to show the positivity rate.
- Add arrow near each data to show the direction of that data trend.
Source
Credits
© 2022 Hider
Inspired by the vaccines widget
Want a custom widget?
- Click here.